
Architects & Construction: How to Share Your 3D Renders and Site Progress Without Sacrificing Quality
Published July 7, 2026 by David
Work in real estate development, architecture, or construction? You know the struggle. You spend 3 hours perfecting a photorealistic 3D render, post it on LinkedIn or Instagram… and the algorithm butchers it. Textures blur, lighting flattens, materials look like melted plastic.
And one image to represent 18 months of work? That’s not cutting it.
Carousels are the answer—but only if you execute them right. Here’s how, step by step.
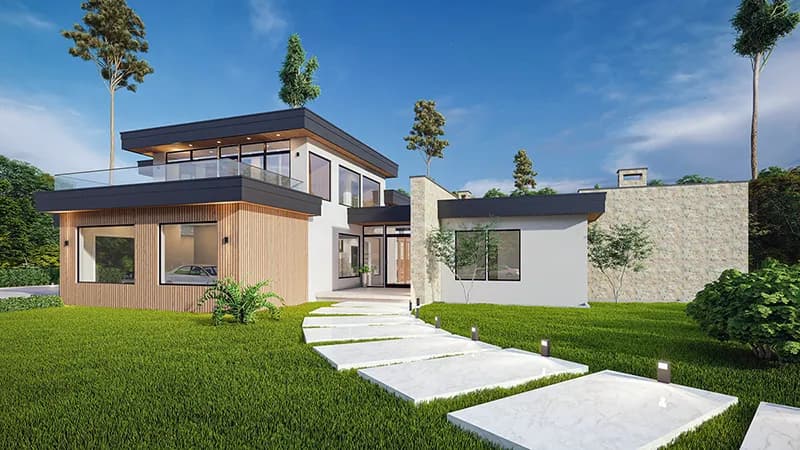
1. Avoid Compression with HD PDFs
On LinkedIn, never upload your images as JPEG or PNG. The algorithm will destroy them. To keep your 3D renders sharp, use the "Document" format (PDF).
In CarouselCraft, when you click "Download," the tool generates a High-Definition PDF optimized for LinkedIn. Your pixels stay crisp, and prospects can zoom in on facade textures without seeing pixelation. (For Instagram/Facebook, the tool exports a PNG with double pixel density. Magic.)
2. Use "Seamless" Format for Panoramic Views
Architecture is about volume. The problem? Instagram forces a 4:5 ratio, but your wide-angle plans are 16:9.
With SmartGrid, import your panoramic image and enable "Seamless" mode. The tool stretches your visual across the full height (leaving space for text) and extends the background over two slides. Your audience swipes to explore the facade—immersive and premium.
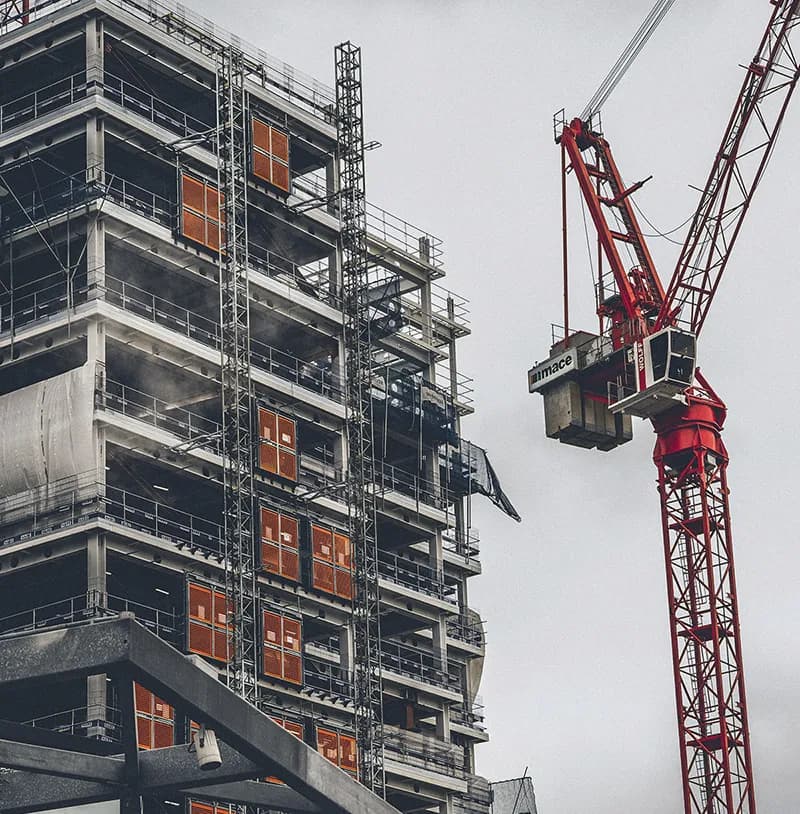
3. Tell the Real Story with Smart Mosaics
Showing the final render is good. Showing the construction challenges? That’s what sets you apart.
Instead of one photo per slide, group your site progress shots:
- 2 photos? A perfect "Before/After."
- 3 photos? A hero image on top with two technical details below.
- 4 photos? A 2x2 grid to showcase pouring or assembly stages.
4. Add Weight with Data Visualization
Clients and developers don’t just care about aesthetics—they want numbers: square footage, timelines, carbon footprint, concrete volume.
Use the Infographic (Data-Viz) block to highlight your stats. Input your data, and the tool generates circular gauges or progress bars. The ultimate way to prove environmental ROI—without cheap-looking design.
Finally Showcase the True Value of Your Projects
Don’t let poor formatting or brutal compression undermine your expertise.
👉 Switch to CarouselCraft Studio! Drag and drop your Twinmotion renders or site photos, and let the tool create a presentation worthy of the buildings you construct.
Les illustrations de ce blog sont généreusement mises à disposition par les photographes d' Unsplash.